Geodata guiding health interventions in IDP camps
Amidst the ongoing conflict and displacement crisis in the Democratic Republic of Congo, utilizing geodata contributes to an effective evaluation of the situation, understand the extent of displacement in a setting where estimating the number and spread of population is never an easy task.
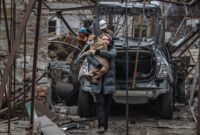
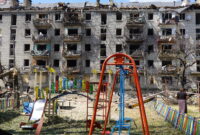
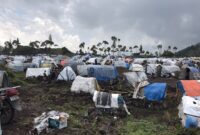
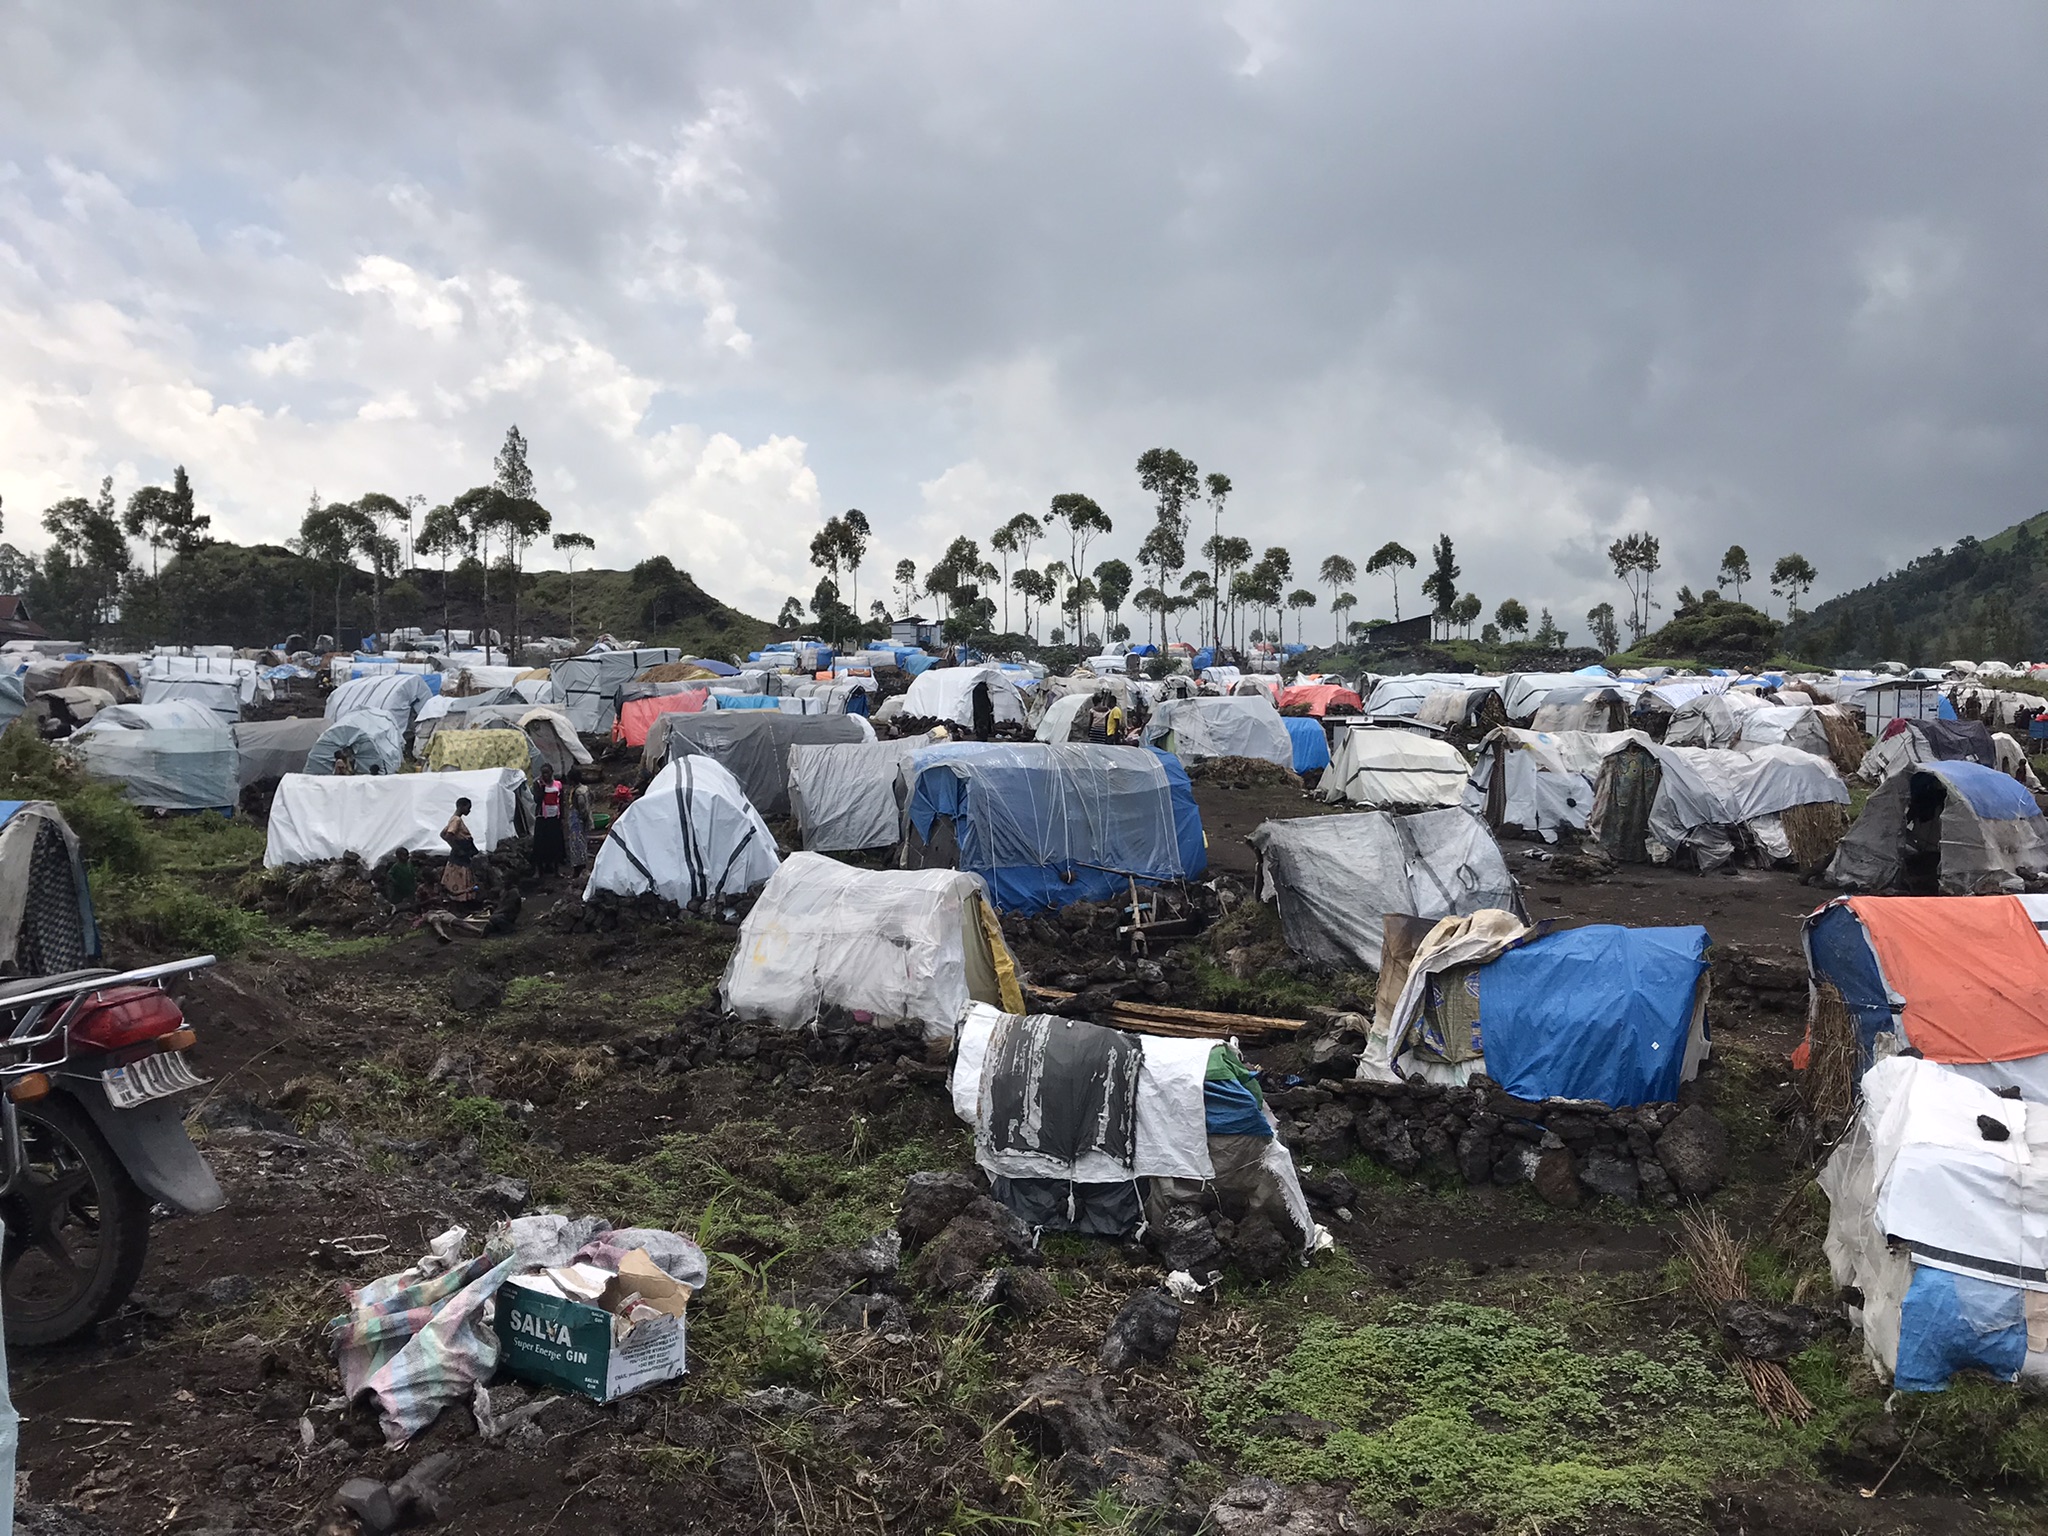
Since March 2022, around one million of people have fled the upsurge of heavy fighting between the Congolese army and militant groups, including the M23, in North Kivu. This is adding to the already high number of internally displaced people (IDPs) in North-Kivu, reaching now a total of approximately 2.3 million (according to the United-Nations Office for the Coordination of Humanitarian Affairs (OCHA). Displacement is still ongoing and very few IDPs dare to return. The majority of IDPs have moved closer to Goma to seek safety and established temporary camps on its outskirts. Living conditions were dire, with people lacking everything; from shelter and food, to clean water and toilets, exposed to the risk of disease outbreaks, as well as sexual violence. Médecins Sans Frontières (MSF) was one of the first humanitarian actors to respond in several of the camps around Goma.
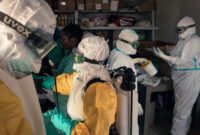
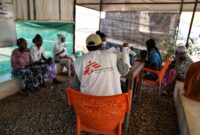
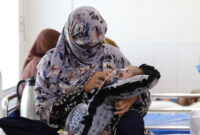
MSF teams are working in several displacement sites close to Goma, including Kanyaruchinya, Munigi, Rusayo, Eloime, Shabindu, Bulengo, Lushagala, Nzulu, Sake and Shasha. The MSF teams first responded urgently to cholera and measles outbreaks in several sites, by providing medical care, building latrines and showers, and bringing thousands of liters of drinkable water for disease prevention. Today, MSF is additionally providing free medical services related to paediatric care and support for sexual violence survivors.
While implementing activities in displacement camps, MSF teams have also conducted field surveys to understand “How many people are there?” and “What is the mortality rate, reasons and places of death?”. In this context, geodata is used as an effective tool for population estimation, mortality assessment, and planning for ongoing and future health interventions.
Remote mapping and sampling
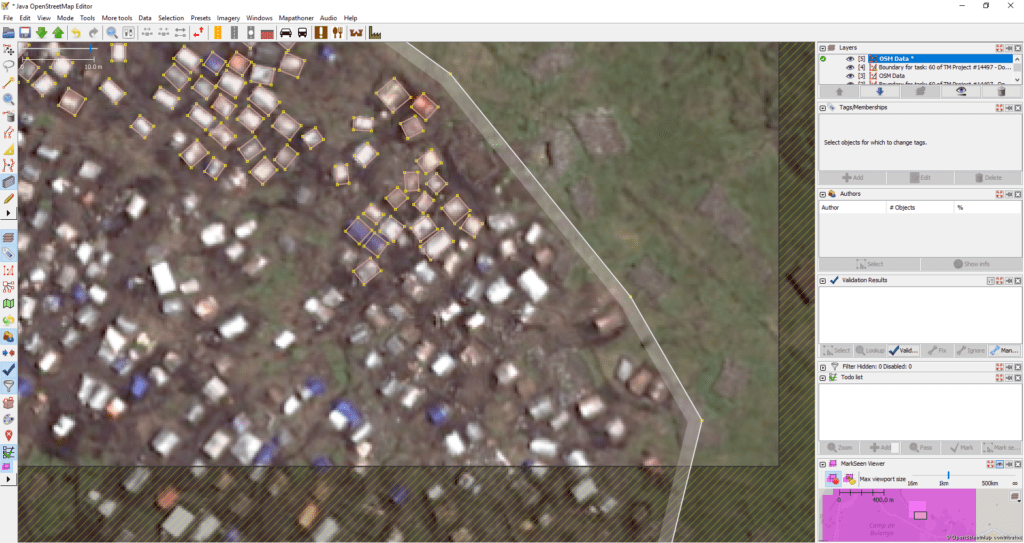
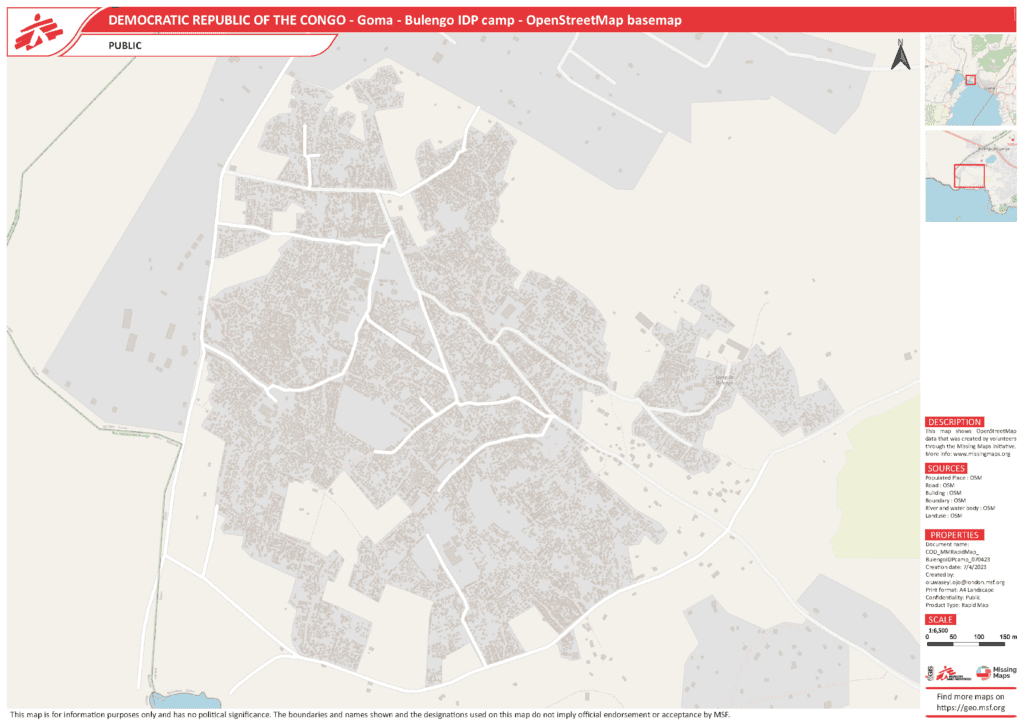
The difficulty for establishing water and sanitation measures or a vaccination plan was that there were no recent, accurate, or specific IDP counts and maps in the massive displacement sites. Through the Missing Maps project, that aims to map areas where people live at risk of or affected by disasters and crises, the MSF emergency operations requested to map the newly established camps in OpenStreetMap (OSM). With help of recent aerial images, the MSF Missing Maps team set up projects in the Humanitarian OpenStreetMap Team (HOT) Tasking Manager, used for managing projects mapped at mapathons. From late March to early May 2023, a handful of experienced Missing Maps volunteers digitized in the JOSM editor over 56,000 shelters and buildings of host community in six IDP camps near Goma in a matter of days: Lushagala, Bulengo, Kashaka, Rusayo, Don Bosco, and Nzulu. These are mappers, who have been taking part in regular community mapathons, supporting MSF operations with the Missing Maps London or Missing Maps Czechia and Slovakia communities.
“This type of mapping was challenging in the beginning. First task open, I was stunned by how many tents had been constructed in such a small area. With more and more mapped tents, I got more comfortable with the precision and speed of the mapping. The overwhelming feeling that I am sitting comfortably at
home and mapping this area remotely, while people there are forced to live completely different lives, is still with me,” shared an expert mapper, who goes by the OSM name anthaas.
With this base map data, a field survey could be organized. The tools used for the survey have been QGIS, Kobo collect, OSMAnd, and the RStudio Statistical Software package, all free and open-source tools. The mapping of the shelters of the camp was followed by spatial sampling. Employing the QGIS software, Oluwaseyi Ojo, the Geographic Information Systems (GIS) intern at the Manson Unit based at the MSF UK, randomly selected a specific number of buildings in each camp that would be represented by points, and grouped and named the selected buildings for easy usage for the surveyors in OsmAnd. This geodata was shared with the GIS specialist and the Public Health Analyst in the DRC. Using teams of two interviewers, about 18 shelters a day could be visited. The goal was to find out how many people sleep there, and gather additional information, related to their health, the nutrition status of children, and deaths in the past three months. The Kobo toolbox was used to design a questionnaire Using a standardized epidemiological study design and the appropriate statistical analysis, MSF could project the numbers gathered from the sample to the whole population.
Challenges of mobile data collection – playful approach helped
The interviewers for the survey had been trained during two days to navigate through the camps to the selected shelters in OsmAnd, a map and navigation app using the OSM map database that can function offline. They would collect information in Kobo collect, when interviewing the residents. There were various challenges with the field survey approach. “We realized there was a shift from the satellite image to the reality, “ said the MSF Public health data analyst Georgios Karanapagos. The initial training assumed a perfect system, that the map was perfect, the mobile was perfect… ”
However, there was a limited precision of the mobile devices. There could be an offset of about seven meters, so one dot on the screen could be matched with three different huts. In a randomly built camp, the navigation was trying to find ways, or streets, within this structure. So, as a surveyor, you might be only a hundred meters away from a point, but it would let you make a huge detour through a supposed ‚street‘ to get there. „We would try to tell the interviewers, look, this is a bunch of shelters, you can just walk past them and go directly to the point,“ recalled Georgios.
“The quality of the mapping was so good that we could even identify easily the huts that had been destroyed in the meantime. Because this is very dynamic camp, lot of the huts are destroyed and built again. In 90 per cent of cases, we could either find the structure that was there, or even the new huts.”
At the beginning, the interviewers did not know how to read the maps. There were no signs, there was no Eiffel Tower to indicate the direction. Because of this inaccuracy, they would end up in the middle of the street, and they would say, there is no hut here. But in every neighborhood, there was one mapped structure bigger than the others; it could be the toilet, the water collection point, or an empty space and that would serve the team to orient. At first, the team had too many points that did not correspond to huts. Georgios spent time with the team checking them out, knowing it would be seven, or up to 10 meter off: „It was a sort of a game. Everyone in the team was excited, when they realized they could see the actual buildings, identify and logically arrive at the right one.“ When they understood the process, they could even correct the trainer, who had taught them how to do it, and who might have had a rotational discrepancy at the moment.
Another aspect to be aware of is the potential bias of the interviewer, based on their preference. You arrive at a point and you see two or three huts that could correspond to the same point in the map. You might be tempted to choose on your personal favour. For example, an eager interviewer may choose the point that is a dwelling with many people in it, so they collect more data. And one who is bored or tired, who does not want to work a lot, may pick a dwelling that is empty. The interviewers need to have all more or less the same approach on identifying the huts.
Besides, the naming of the sectors and of the subsectors was so random and developped day by day, that there was no consistency. The Geographic Information System (GIS) specialist is contributing to redefining all the section boundaries, and now former camp management is getting organized in Rusayo, Lushagala and other sites.
What is next?
After the field data collection, the Public health data analyst and the GIS specialist proceeded with cleaning the data. They worked with Excel files in QGIS. The mobile devices were reporting the GPS coordinates, composed by latitude (north-south position) and longitude (east-west position) with an inherent imprecision. Naming mistakes also happened: observing the spatial data in QGIS, they could see the point they had identified as B_12 was very close to B_I2, it did not always correspond to the map location, e.g. I and 1 could be interchanged.
The data analysis is ongoing. Most of the huts are the sleeping huts, but some are used as toilets, for storing or cooking food. The team determined the proportion of the sleeping huts with the study. By asking how many people slept in the building the night before, they could get a good estimate of what is the population residing in the camp, by multiplying the sample with an appropriate weight. In addition, if the camp is expanding a lot in the next two to three months, the organization can task another aerial image in three months. The GIS and data specialists can impute the structure, and the use of the camp, by the recent data analysis. Taking the proportion of the sleeping huts as a base, we expect the use of the huts will be similar, and can also project the use in the new population estimates.
Epidemiological surveillance data helps MSF to monitor and follow the course of an epidemic. Cholera is endemic in North Kivu. With vulnerable people living in crowded conditons without access to clean water, the situation escalated to a cholera epidemic in March 2023. Epidemiologists can see whether the epidemic is limited to the camp population, or when it starts to spread into the resident population. This data helps humanitarian workers to prepare rapid response mechanisms, such as provision of safe water and latrines, at the earliest signs of a spread. In addition, from retrospective data analysis, MSF can gain a better understanding of the characteristics of the epidemic outbreak, such as how quickly it spreads, effect of the response, and profile of affected populations, which helps to respond faster and better to the next epidemic, saving lives especially in the early days of an outbreak.
The method is already getting duplicated in other camps, where MSF is using the same method to undertake a field survey. The use of OSM data digitized from satellite images, spatial sampling for a field survey and the epidemilogical data has served to guide our medical action. MSF support, including the establishment of cholera treatment centres and basic health services, health promotion programmes, the provision of safe water, the construction of latrines and the implementation of a vaccination programme has helped to contain the cholera epidemics and reduce the number of cholera cases to pre-epidemic levels.
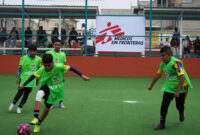
With cholera epidemics under control, other health and social issues have come into focus: a high number of measles cases due to low vaccination coverage, the poor nutritional status of many children, violence in the camp, especially against women, the missing or overcrowded camp schools, the lack of income opportunities for camp adults, etc. While the impact of geodata on the MSF health interventions in the IDP camps has been to estimate their populations, understand the levels and causes of mortality, and facilitate learning within the organization, the OSM data is available for other humanitarian organizations. The data can serve more efficient situational awareness and decision-making of aid workers concerning projects aimed to help those who need it the most.